Projects
YETI DCF Model
Built an Excel‑based discounted cash flow model for YETI, projecting revenue, margins, and free cash flow while applying an appropriate WACC and terminal value calculation. Features sensitivity tables for key assumptions and provides intrinsic value estimates across scenarios.
Download Project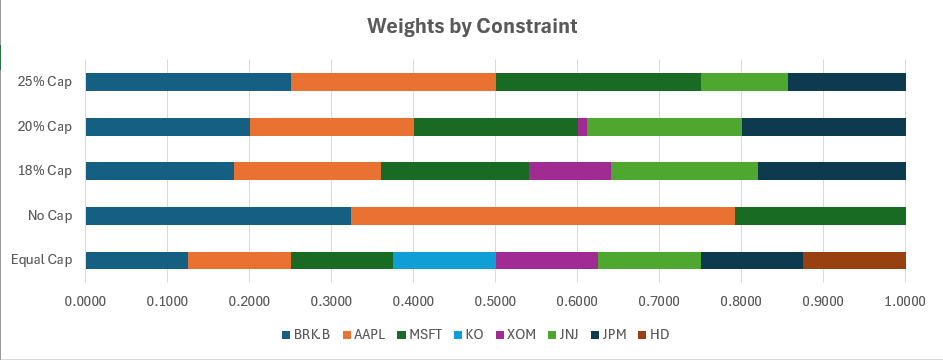
Sharpe Ratio Optimizer
Ultilizes Excel and takes 8 example stocks and their historical price data to calculate the optimal portfolio allocation that maximizes the Sharpe Ratio. Creates different allocations based on stock caps and compares the resulting portfolios' performance using various metrics and visualizations.
Download Project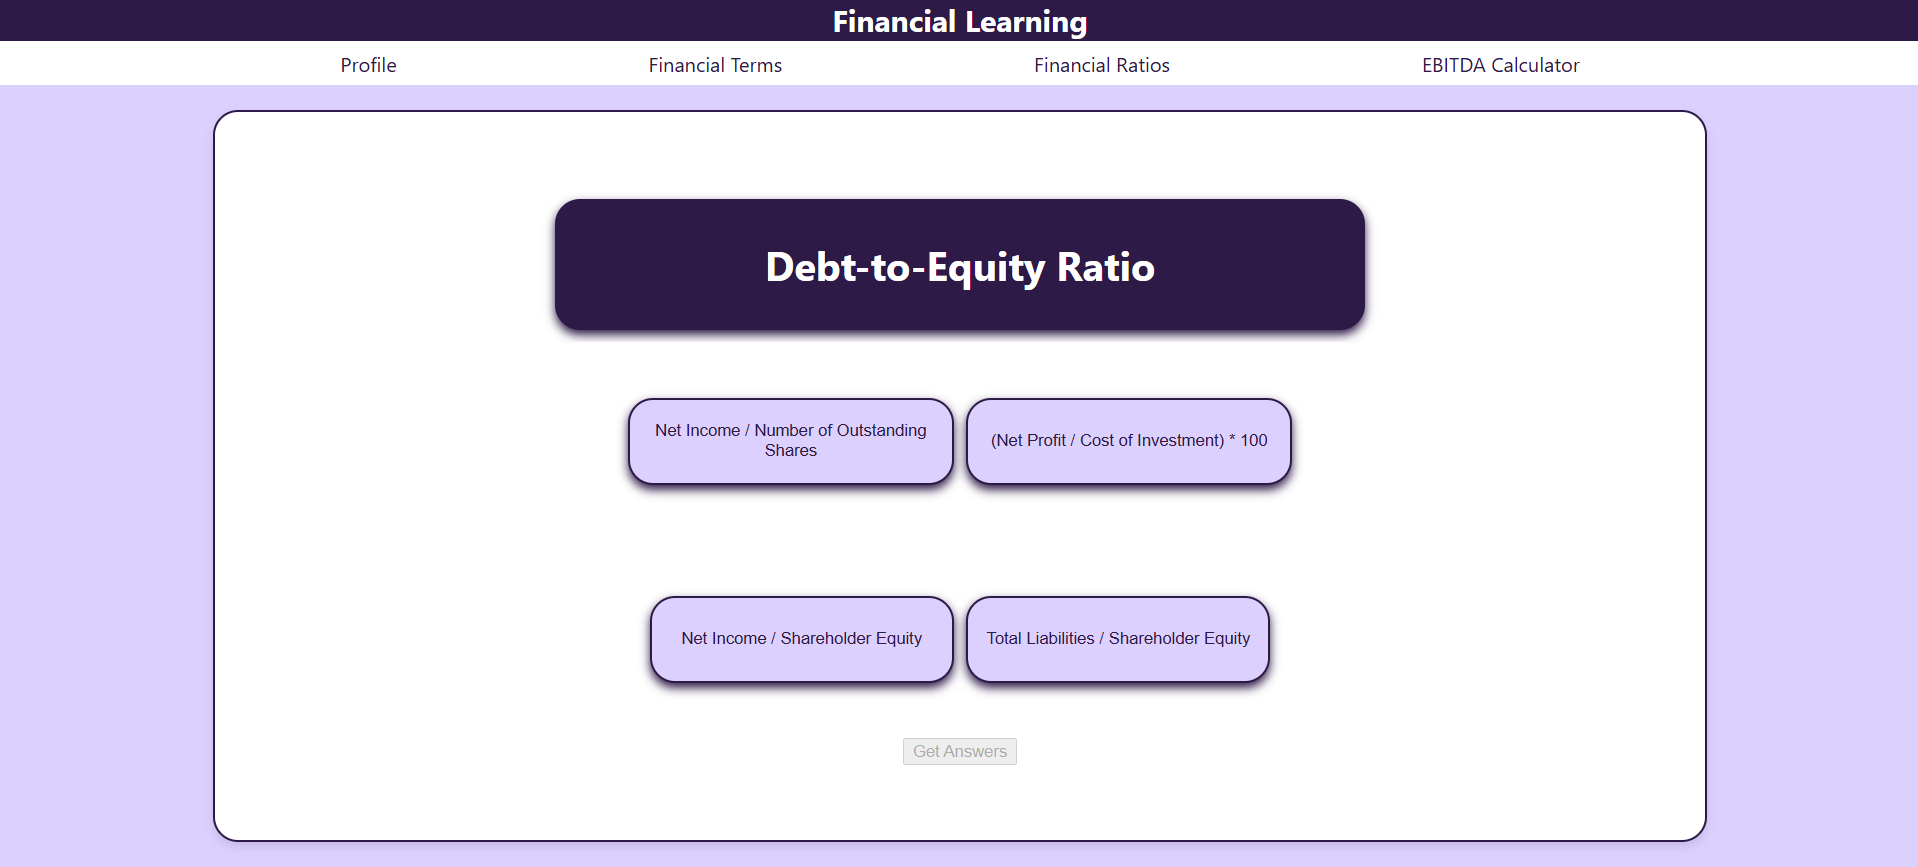
Financial Learning
A web application that allows users to learn about financial concepts through interactive quizzes and resources. The app is built using React and Node.js, with badges and statistics to track user progress. Made at UGAHacksX hackathon. Project concept provided as a challenge by the UGA FinTech program from Truist.
View Project
NHL Weather API
A Java executable that uses the OpenWeather API to get the current weather for a the hometown of a user-selected NHL player. The program uses the NHL API to get information about the player, and then pipes the hometown of the player to the OpenWeather API to get the real-time weather for that location.
View Project